

PROJECT INFORMATION
New systems start clean, so savings are minimal at first.
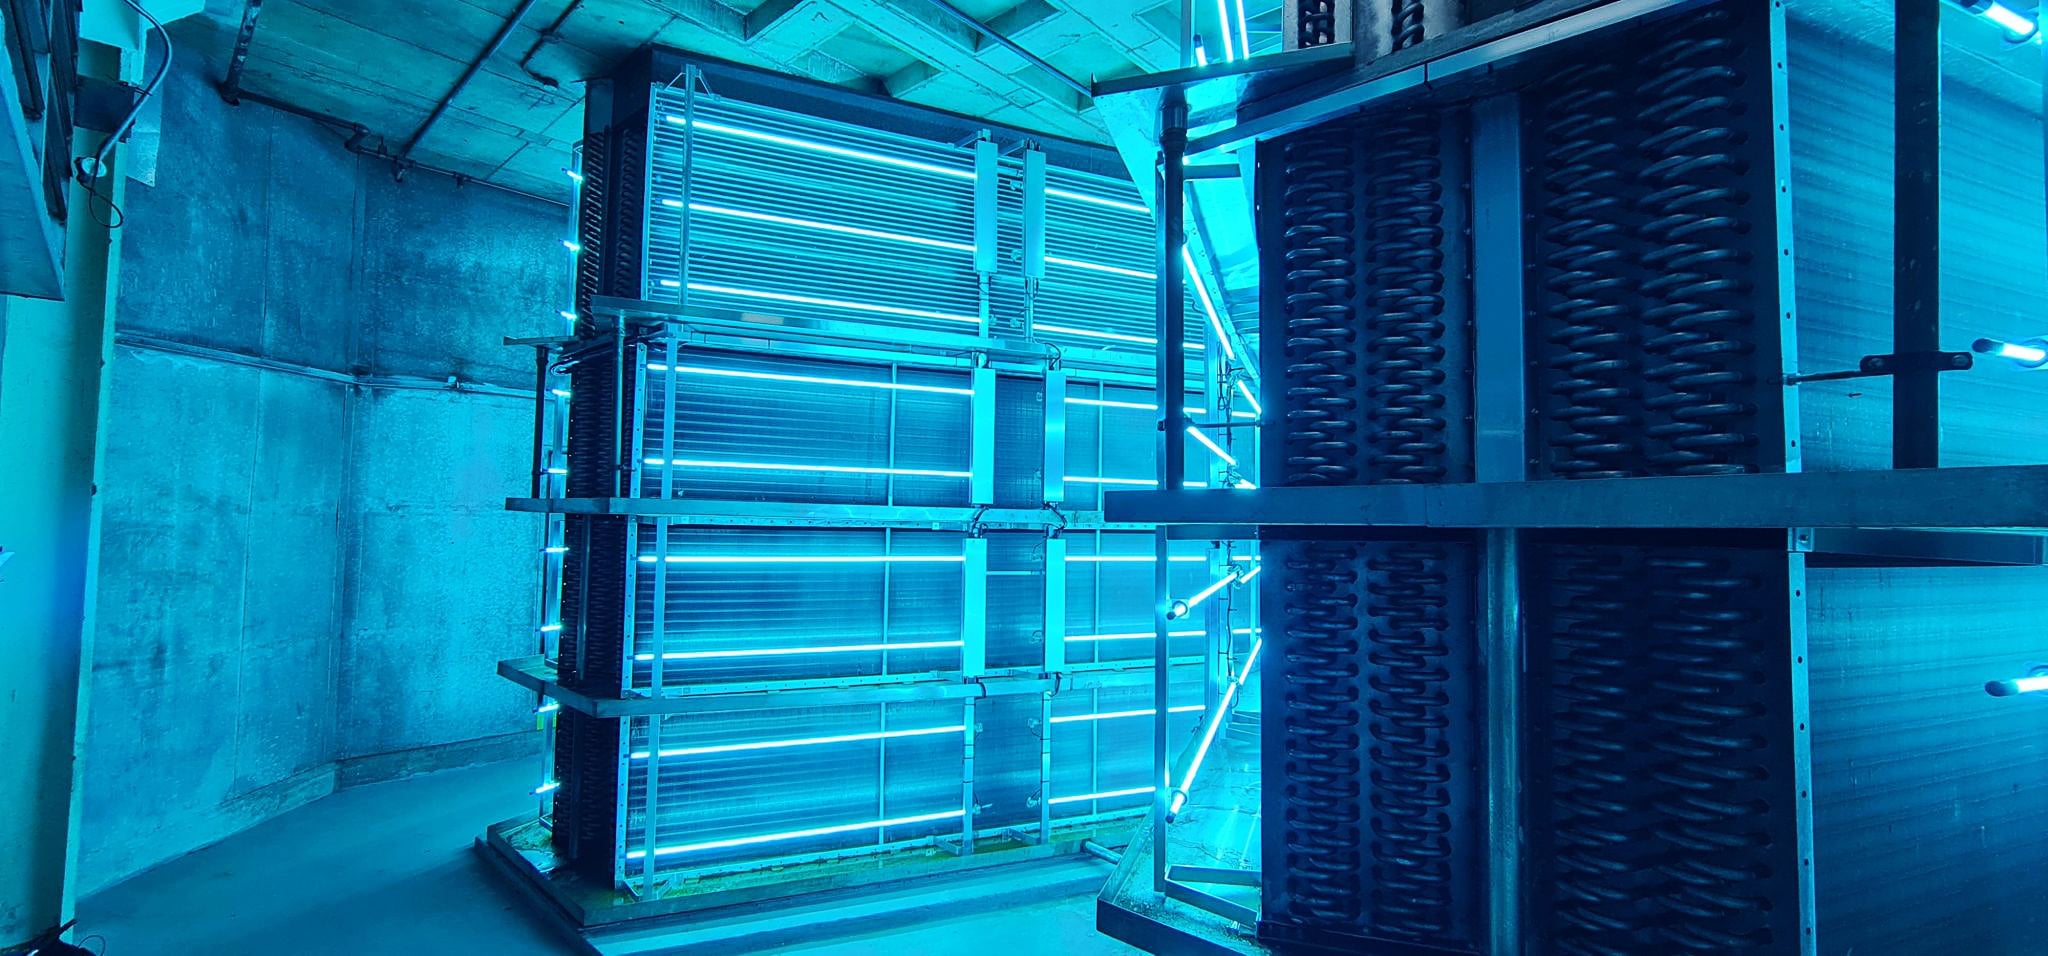
The Clean and Dirty coil defaults in the System Configuration represent a typical fouled coil condition that develops over time without UV-C protection.
SYSTEM CONFIGURATION
THE LOGIC
With over 50 years of combined experience between UVR and Steril-Aire, our UV-C technology expertise spans across diverse applications.
• Environmental Assessment: Temp & humidity
• Load Calculation: Thermal & airflow
• Performance Metrics: Efficiency improvements
• Solution Engineering: Custom UV-C design
THE REFERNCES
1. ASHRAE Standard 185.2-2020
2. U.S. DOE & PNNL Report
3. EMC Engineering Case Study
4. ACHR News Technical Report
5. UVR Resources Technical Library
THE MATH
We quantify the impact of UV-C by pairing the fan energy you save when coils stay clean with the small energy UV-C uses and the maintenance you avoid. All results use your project’s CFM, coil pressure drop (Dirty–Clean), operating hours, energy rate, lamp set, and system cost—so the payback is specific and defensible.
HOW THE FINANCIAL ANALYSIS WORKS
UV-C Energy Cost (E):
kWh/yr = (Per-lamp W × #Lamps × Hours) ÷ 1000
Annual $ cost = kWh/yr × $/kWh
Annual Net Savings (E + M):
= Fan energy savings + Maintenance savings − UV-C energy cost − Replacement-lamp cost
Simple ROI (Payback):
= System cost ÷ Annual Net Savings
4-Year Cumulative (E + M):
= (Annual Net Savings × 4) − System cost
Maintenance (M):
Annual coil-cleaning savings (input) minus annual replacement-lamp cost (input)
UV-C Energy Cost (E)
kWh/yr = (Per-lamp W × #Lamps × Hours) ÷ 1000
Annual $ cost = kWh/yr × $/kWh
Pressure Restoration:ΔP = Dirty PD − Clean PD (in. w.g.)
Fan Energy Savings:
kW_saved = (CFM × ΔP ÷ 6356) × (0.746 ÷ η_fan)
Annual $ saved = kW_saved × Control Factor × Hours × $/kWh
Engineering Constants:
η_fan = 0.60** (60% fan efficiency)
635* cfm·in.w.g./hp (ASHRAE Standard 185.2)
0.746 kW/hp conversion
Control Factor = 0.80** (80% VFD efficiency)
FOR THE ENGINEER
Fan Operation: Assumes constant airflow via VFD or static pressure reset control. In these systems, fan power decreases as pressure drop decreases. Constant-speed fans may see less energy reduction (airflow increases instead).
Air Density: Calculations use standard air density (0.075 lb/ft³ at 70°F, sea level). For altitude or unusual temperature, adjust the 6,356 constant by (0.075 ÷ actual density).
Fan Efficiency (η_fan): Default 0.60 represents full wire-to-air efficiency, including fan, drive, and motor losses. Editable per project if detailed fan data are known.
ΔP Measurement: Pressure drop (Dirty–Clean) should represent the coil only, measured under equal airflow for both conditions.
Coil Cleaning Dynamics: UV-C cleaning is progressive. A fouled coil typically restores over several weeks, with full steady-state savings achieved once clean. This model represents the maintained clean-coil condition typical after restoration.
Operating Hours: Default 8.760 hours per year represents annual fan runtime; adjust for actual occupancy or control schedule.
Energy Rate: Uses a flat $/kWh rate for simplicity; demand and time-of-use factors are excluded, making results conservative.
UV-C Power: Lamp wattage values represent input watts (lamp + ballast/driver losses) at full load.
Thermal Benefit: Coil heat-transfer improvements (which reduce compressor load) are not included—only fan energy and maintenance savings are shown.
Fan kW Constant (8515 vs. 6356):
ASHRAE Standard 90.1 and 185.2 typically use 6,356 CFM·in.w.g./HP to convert airflow and pressure into fan power.
The value 8,515 used here includes a built-in correction for system and drive efficiency (η ≈ 0.60), effectively combining both the mechanical and electrical conversion factors into one constant.
This simplifies the equation without altering the resulting energy value—it’s an adjusted ASHRAE-based constant reflecting real-world fan system performance.
Note: This analysis is based on the provided inputs and industry-standard assumptions. Actual results may vary based on specific installation conditions, energy costs, and usage patterns.


